|
|
|


|
摘要
在台灣的災害預警系統中,有效的時雨量或累積雨量是最常被使用的指標之一,但因為雨量與災害的連結上,充滿了許多的不確定性因素,因此雨量的警戒方式還有賴許多經驗上的判斷。為了提供一套輔助判斷的工具,我們使用Tableau設計一套檢視雨量的視覺化分析模板,並透過610水災事件做為系統檢核的資料。在此系統中共有三個介面;第一為「台灣行政區豪雨警戒瀏覽器」,目的是呈現出達豪雨警戒的鄉鎮縣市總數隨時間的變化情況。第二個介面是「豪雨歷時播放器」,目的是讓使用者可以接續查詢鄉鎮縣市的地理位置,並可透過此介面查詢達大豪雨警戒的鄉鎮列表,以及其對應的警戒雨量站是否也達到該雨量站的淹水警戒標準。最後一個介面是「雨量站時雨量瀏覽器」,其目的則是提供雨量站的原始時雨量與淹水警戒標準。在此系統原型中,可以提供使用者不同角度的檢視方式,從宏觀的鄉鎮總數到微觀的時雨量資料,並且可以在未來透過不同災害潛勢的圖層套疊,延伸此系統在不同災害應變上的應用。 Abstract For disaster alert in Taiwan, the effective hourly or other accumulated precipitation is used as warning threshold value. However, rainfall alert still depends on experimental estimation due to many uncertainty factors between precipitation and disaster. In order to provide an assisted tool, the data visualization skill may be applied in this problem. In this case, the Tableau is used to design a visualization prototype and 610-flood event is applied for testing the system. As for this system, three modes have been built as District Rainfall Alert Browser (DRAB), Rainfall Timeline Browser (RTB), and Rainfall Hyetograph Browser (RHB). The total amount of county or town can be revealed with time by DRAB, and further information such as mapping position, corresponding rainfall station of town, and flood criteria of rainfall station can be inquired by RTB. The rainfall hyetograph and flood criteria also can be surveyed in RHB. In this visualization prototype, different aspect from globe to local is provided with time and space. The distinct disaster potential maps will be telescoped for application of different disaster emergencies in future extension. |
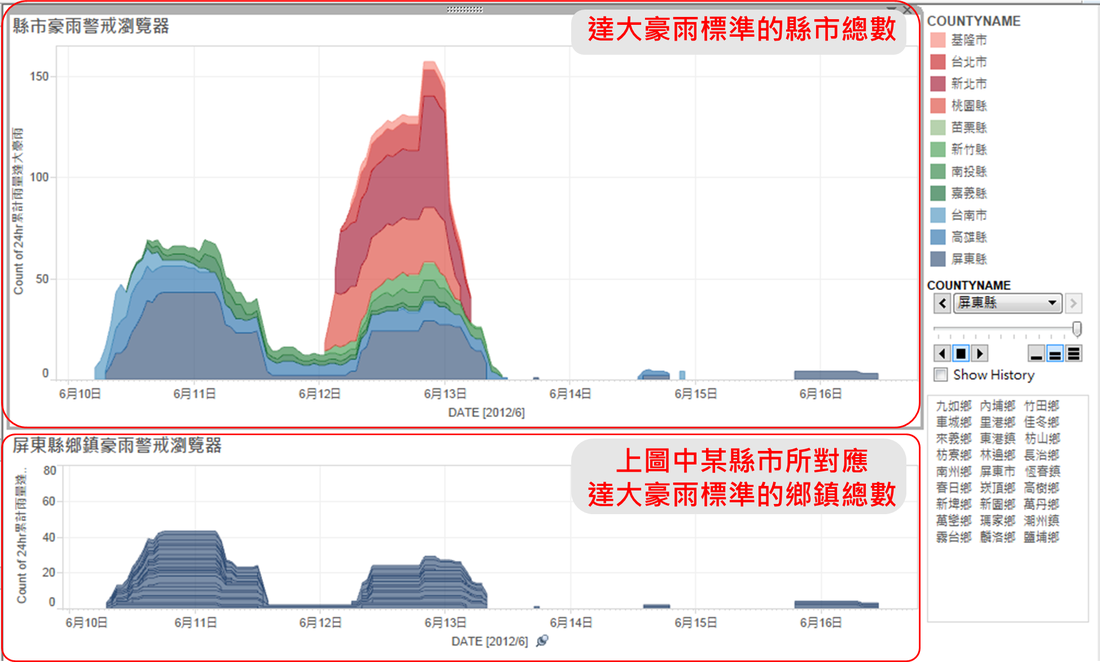
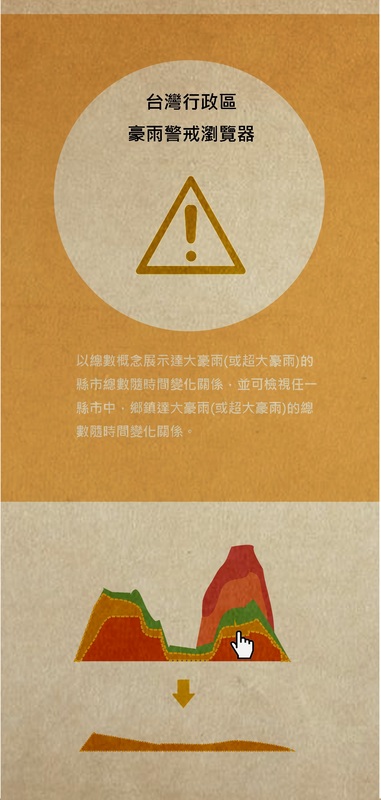
圖一、台灣行政區豪雨警戒瀏覽器
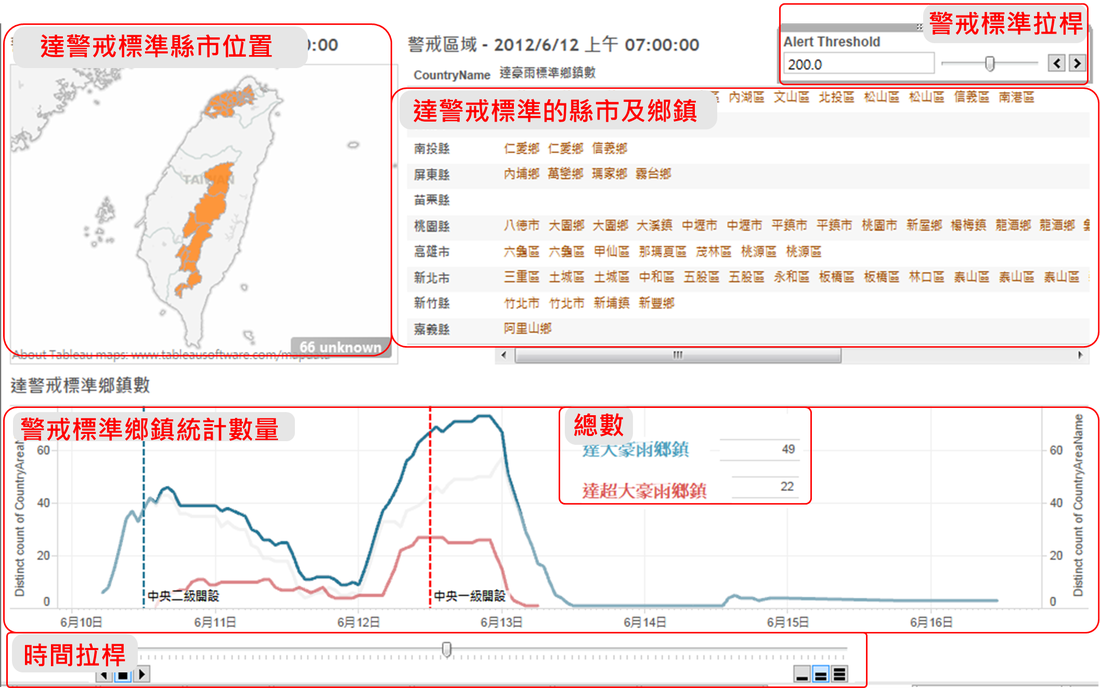
圖二、豪雨歷時播放器
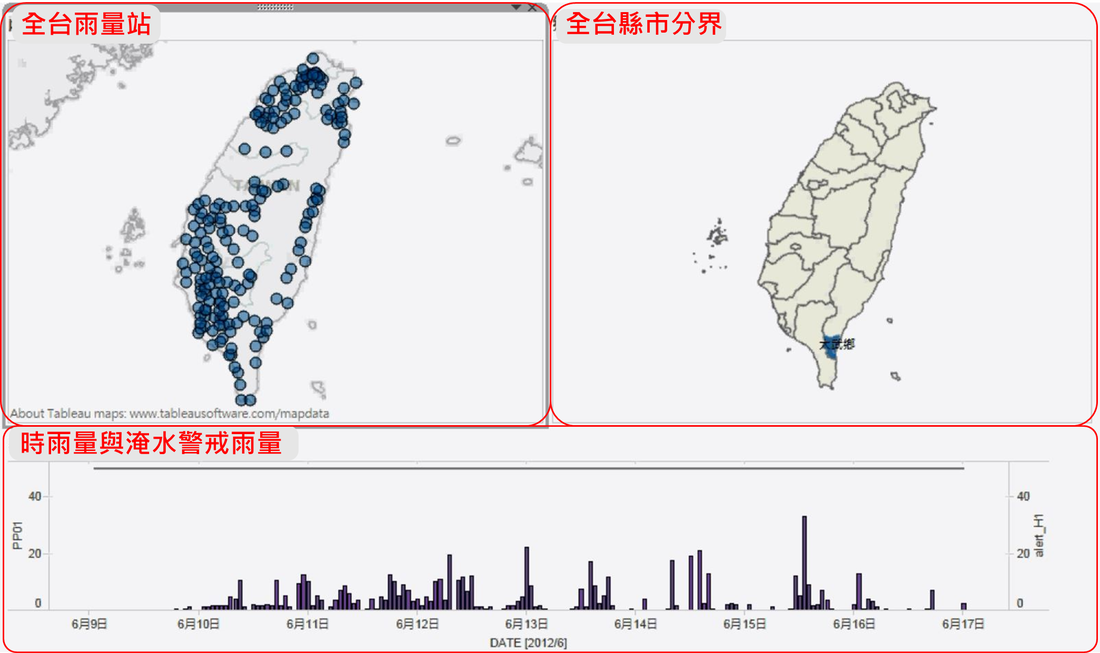
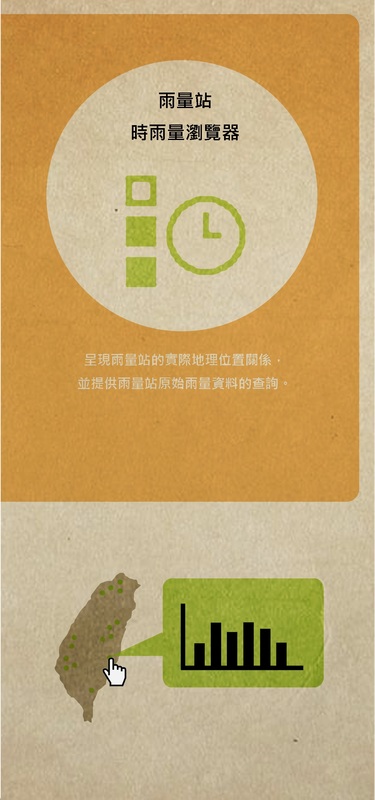
圖三、雨量站時雨量瀏覽器
|
